The end of the year is upon us and while we’re measuring impact of our marketing programs on revenue for the year we’re also planning for the following year. By now, many people have a first pass complete of their demand gen plans and associated budgets while others are in the final stages of refining those numbers. Either way, it’s important to know if your budgets are aligned with corporate revenue goals. Knowing this either gives you the confidence that you’ll be able to contribute to revenue goals or gives you the ammunition to ask for more budget.
For some, budget planning can be a daunting task. Still others may simply not know how to determine if their demand gen budgets are adequate to support company goals. But if you have access to funnel metrics and campaign attribution data, the task is actually quite straight forward.
So where do you start? You need to gather accurate historical data from the current year you are closing out. Specifically, you’ll need lead volume, number of deals closed, average deal size, average sales cycle length and overall inquiry to close rate. You’ll also want to calculate your average cost per lead. Next, get the goals for the new fiscal year. What is the sales goal? Average deal size goal? (Does it stay the same or increase?) What is the average sales cycle length goal and how does that timing affect hitting your goals, especially at year end? Once you have that information, you’re able to reverse the funnel and create a demand gen plan budget that comprises the number of leads required to make revenue goals.
Below is a worksheet to help you get organized.
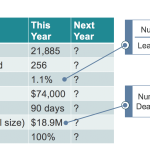
Now you’re ready to fill in the information for the new fiscal year. The first piece of information you’ll need to collect is the sales revenue goal along with average deal size goal. You’ll also want to set a goal for conversion rates – will they stay flat or will they improve? Once you have the relevant info, you’ll be able to calculate the number of deals needed.
You can see in the example below, I’ve decided that with optimized business processes and campaigns I would be able to increase conversion rates from 1.1% to 1.3%. Similarly, I’ve agreed with my sales team to have an increase in the average deal size by $1K. Lastly, with management I’ve agreed that marketing will be responsible for 50% of the leads and sales will share the rest of the load. With these assumptions and knowing that our revenue target increased to $30M, I can start filling in the gaps.
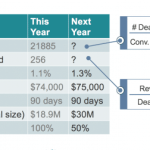
The next step is to calculate the number of needed deals closed. This is pretty straight forward. Take your revenue number and divide by the average deal size in order to get to the number of deals needed. Lastly, take the number of deals and divide by conversion rate in order to get the total # of leads to support your revenue goals. If marketing is responsible for 50% of leads (perhaps sales has responsibility for the other half) then simply divide by two.
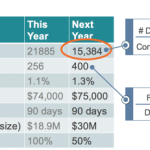
For our current example, the revenue goal of $30M is divided by an average deal size of $75K which means that 400 deals closed are needed. The needed lead volume is calculated by the number of deals (400) divided by conversion rates of 1.3% = 30,769 leads x 50% sourced by marketing equals 15,384 leads needed for 2017.
From there, determining a budget to support the volume of leads is also relatively easy if you know your average cost per lead (CPL.) So if your average CPL is $100, then your needed budget is $1,538,400.
There are a couple of other planning considerations before you can call it a done deal. The first is the spreading out of your leads across the year through quarterly planning, including seasonality you experience in your business and industry. The other is timing, which involves accounting for the overflow of year-end 2016 leads as well as forecasting the number of leads you need in Q4 2017 in order to ensure the following year is off on the right foot. While this can seem tedious, it’s not too difficult.
For example, if you have an average sales cycle of 90 days, your 2017 revenue will benefit from Q4 2016 activities and leads, but will also be offset by deals that won’t close until 2018. For the former, take the (estimated) impact of the revenue from those leads and subtract from your 2017 revenue target. Say you have 1,000 leads in Q4 that we’ll assume close in Q1 2017. At the above 1.1% conversion rate and $74K average deal size, that’s a total of $800K that you don’t have to chase in 2017. Now for the back-end, if you assume the Q4 2017 leads won’t yield revenue until 2018, then you are missing one full quarter (1/4) of your full-year leads. You must make up this difference by generating revenue (and leads) from the first three quarters of the year, whether that difference is evenly spread or strategically targeted throughout the year.
For a webinar on this very subject, you can turn to one that I did a month ago called From Napkin to Blueprint: Mapping a Marketing Plan With Your Metrics.
Transform how to track campaigns with out-of-the-box marketing attribution tools. Start making the right marketing decisions today.