Marketing and sales are part of the same demand generation team in most companies, but sometimes it doesn’t feel like it. Keeping marketing and sales in alignment is a tough task because too often marketing’s data is siloed in a marketing automation system and sale’s data is siloed in a CRM system like Salesforce. Consequently, the sales team may have no idea what marketing is doing beyond the leads that get tossed over the fence to them and that they may or may not want to follow up on.
The solution to this problem is to use Salesforce as the one source of truth for your entire demand generation organization. With Salesforce as the repository for all your customer data, you can get complete visibility across both the marketing and sales funnels and can streamline revenue generation company-wide.
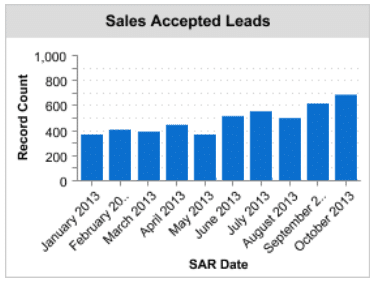
1. The Number of Sales Accepted Responses (SARs) Generated By Campaign
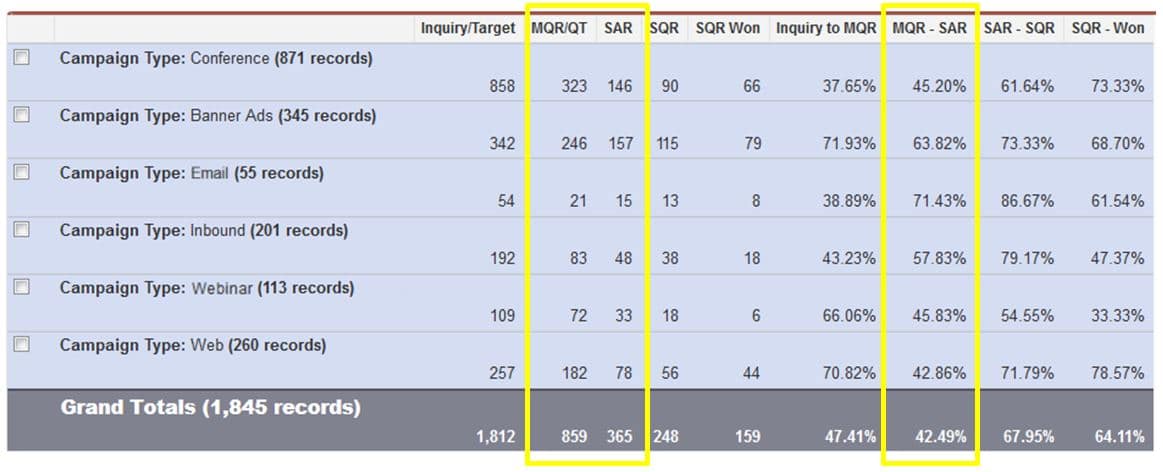
Volume and Conversion Rates of SARs Generated by Campaign Type
The number one thing that sales looks for from marketing is names to follow up with to potentially generate opportunities. Providing the VP of sales insight into which campaigns not only generate the most Sales Accepted Responses but also have the highest conversion rates through the rest of the funnel in real-time is key. The sales team is able to see exactly how every marketing program helps provide tangible leads for them to follow up with. In the chart above you can see the volume and conversion rates of every campaign type that was run this year – emails had the highest conversion rates from marketing to sales, but banner ads actually drove the most SARs.
2. How is the Marketing-Sales Handoff working?
Marketing Qualified Leads-Sales Accepted Leads Conversion Rates Over Time
These graphs show perhaps the most critical interaction between marketing and sales – the handoff between Marketing Qualified Leads (MQLs) to Sales Accepted Leads (SALs). Funnel reports like these show if there are bottlenecks in the demand generation process and enable marketing and sales to have a conversation about why the conversion rates between the stages may be going up or down. Here you can see that while at the end of Q3 2013/beginning of Q4 marketing and sales seemed to be on the same page, in the beginning of the year MQLs seemed to go up at a much higher rate than SALs. Perhaps marketing changed their score thresholds to convert to SAL or maybe sales started following up more quickly so fewer SALs got lost.
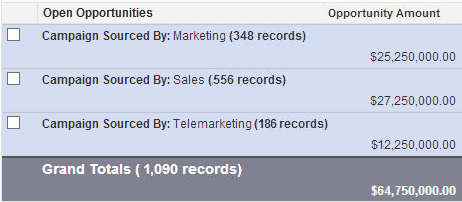
3. Number Opportunities Sourced by Department (Marketing, Sales, Telesales)
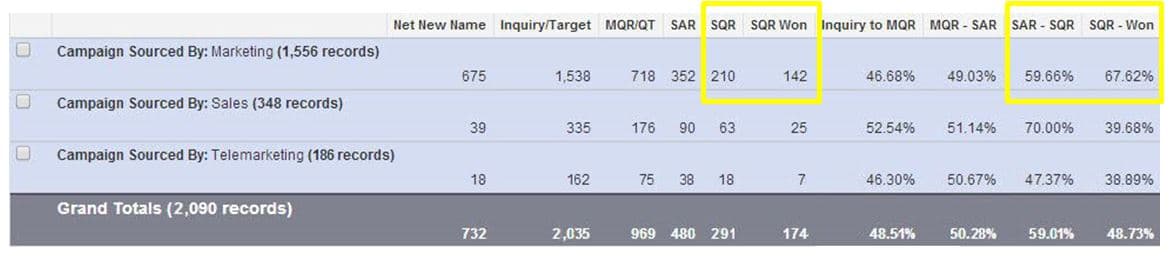
Number of Sales Qualified Responses (SQRs aka Opportunities) Sourced This Year by Department
Generating lots names for the sales team to follow up with is great, but the VP of sales is usually interested in more than just raw volume. The VP of sales wants marketing to pass quality leads over to his or her team. Tracking the number of opportunities that sales generates from names that marketing sourced is a good way to show the value that marketing provides in terms of helping sales hit their quotas. The report above shows the number of Sales Qualified Responses generated this year by each department, how many were converted to wins and the percentage conversion rate from SQR to close. In this example, marketing generates the most SQRs and also the highest close rate.
4. Which Campaigns Influence the most Opportunities?
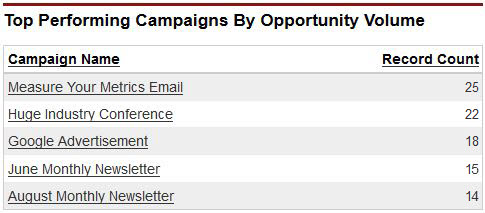
Most Opportunities Created by Campaign
Take the last report one step further – instead of looking at just the number of opportunities that sales created that were influenced by marketing, this report shows the specific campaigns that generate the most opportunities. If the VP of sales has access to this type of information he or she can work with marketing to run more campaigns of this type to maximize the number of opportunities and potential revenue that marketing provides to sales.
5. How much Pipeline and Revenue does marketing influence?
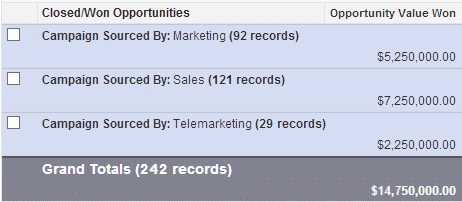
Total Revenue Influenced by Department
Total Pipeline Influenced by Department
Influenced revenue and pipeline are great summary reports to show the entire sales department. While marketing may not play a direct role in closing deals the same way sales does it plays a huge role in generating pipeline and closed revenue. Marketing campaigns set up a large percentage of closed deals in most large enterprises and the VP of sales wants to be able to see just how much pipeline marketing is teeing up for his or her team to close. Plus showing how much closed revenue marketing has sourced doesn’t hurt either!
Sales executives may not always look for these exact metrics but if you can accurately show sales metrics like the ones above (in the environment they live in, i.e. Salesforce) it will go along way to keeping marketing and sales on the same page. Showing the amount of names marketing provides to sales, the conversion rates from those names to opportunities, and the amount of total pipeline (both open and closed) that marketing has played a role in creating goes a long way to keeping sales executives happy. Even better, it keeps marketing and sales on the same page and enables the entire demand generation organization to get more effective over time.
Check out our whitepaper to learn more: Top 5 Reports Sales Wants From Marketing.
Transform how to track campaigns with out-of-the-box marketing attribution tools. Start making the right marketing decisions today.