 What is lift analysis and why should you use it?
Lift analysis is a measurement of how a Campaign impacts specific key metrics like deal velocity, conversion rate, or average deal size. When it comes to multi-touch attribution, a marketing lift analysis can be applied by looking at Opportunities that were influenced by your Campaign (i.e., your treatment group) and comparing that with Opportunities that were not influenced by your Campaign (i.e., your control group).
By comparing your treatment group against your control group, you can see the “lift” in each of the metrics mentioned above and make data-driven decisions about which Campaigns to invest in or which Campaigns to stop investing in.
Note: It’s worth mentioning that because you are looking at existing Opportunities and the Campaigns you might be measuring weren’t purposely applied to your treatment group and purposely not applied to your control group, the results are less accurate than if you were doing a real a/b test (e.g., where treatment group and control group are equal). However, this type of marketing lift analysis is still useful, just be aware of flaws in your data like small sample sizes that might bias your results.
Let’s take a look at an example…
Example: What impact did my marketing campaign have on deal velocity?
Let’s say our marketing team has been hard at work developing a late-stage nurturing program in Salesforce in an attempt to increase deal velocity. Our program has been running for the last few months and we want to check in on whether this program has helped reach our intended goal of quicker deals.
First, we need to pull a report of all of our won Opportunities that were influenced by our late-stage nurturing program and calculate the average deal velocity (i.e., the average # of days between Opportunity Create Date and Opportunity Close Date on Closed Won Opportunities). We can easily do this by creating a Campaign Attribution report, using our Full Circle Attribution Model:
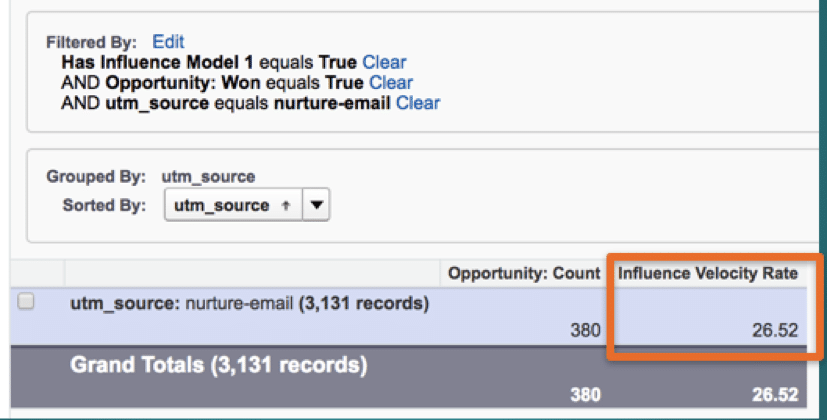
marketing campaign lift analysis
Here we see that the average deal velocity is 26.52 days. Now we need to compare this against our control group of Opportunities that were not influenced by our late-stage nurturing program. We do this by creating the inverse of the report above. Using a cross filter in Salesforce, we can calculate the average velocity of Closed Won Opportunities that were not influenced by our late-stage nurturing program:
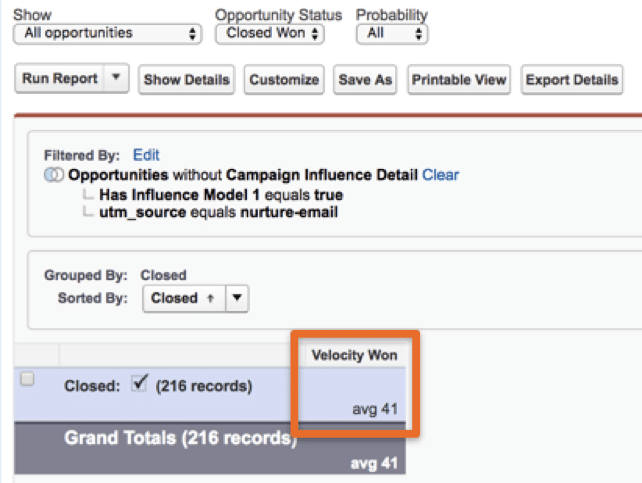
measure campaign’s effect on deal velocity
Here we see that the average deal velocity is 41 days, an average of 14.48 days longer than deals that were influenced by our late-stage nurturing program. That’s a pretty significant increase. I think we can call from our marketing lift analysis that our nurturing program a success!
[Webinar] 3 Tips for Finding Insights with Multi-Touch Models
Join us as we use Campaign Attribution data to determine your marketing touchpoints and their revenue contributions all while optimizing your campaign mix.
Transform how to track campaigns with out-of-the-box marketing attribution tools. Start making the right marketing decisions today.