A lot of marketing people we talk to want to know how to get started measuring their marketing. One of the best ways to start using marketing analytics is to get a baseline on your current performance.
Say you have the following performance metrics:
- Generate 500 MQLs each quarter
- Improve conversion rates from MQL (marketing qualified lead) to SAL (sales accepted lead) by 20%
- Source 30% of the revenue
- Influence 60% of the revenue with marketing programs
- Improve deal velocity by 10%
Below are a series of charts that you can get from Salesforce using Full Circle Insights to help you set your baseline marketing performance.
Generate 500 MQLs Per Quarter and Improve Conversion Rates to SAL
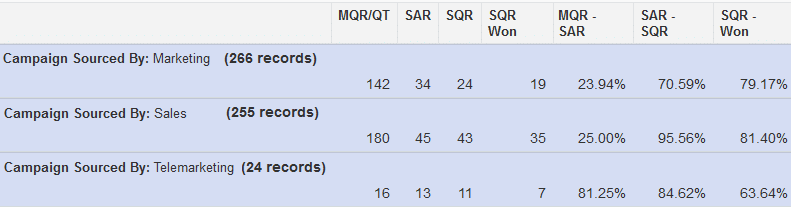
This first chart shows the volume and conversions by stage that are sourced by marketing, sales, and telemarketing teams. The report is based on when the responses came in and 266 responses came in last quarter and you can see they are in different stages in the sales cycle right now. If the metric is 500 MQLs per quarter, the chart shows you’ll need to nearly double the response volume.
Just a quick note on “Lead” vs. “Response.” In Salesforce, there are two types of data that represent a person – a Lead or a Contact. In Full Circle Insights, the system keeps track of both types of individuals that respond to campaigns so you don’t just get the Lead numbers, you also get the Contact numbers. We call that a “Response” because it includes responses that can be either Leads or Contacts in Salesforce. So we also use the terms MQR (marketing qualified response) to indicate that we’re including both Leads and Contacts.
This first chart also shows the conversion rates by stage. You can see that responses sourced by marketing have a 23.94% conversion rate from MQR to SAR. So the sales team is only accepting 1 out of every 4 MQRs. If you work to improve your conversion rate by 20%, your goal would be to get to 28.74% conversion rate. This goal would suggest a conversation with the sales team to understand what they are finding useful. You might also want to know if there are any key campaigns that have higher conversion rates and focus efforts on those.
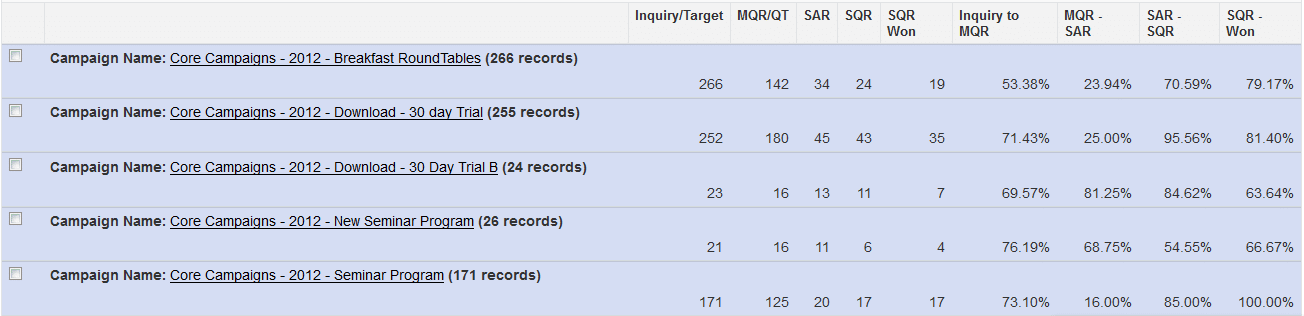
This report above shows a listing of campaigns and the conversion rates. So for example, the Breakfast Round Tables have a 53.36% conversion rate. Focusing on these types of campaigns and de-emphasizing other campaigns with lower conversion rates might do the trick so you can meet your goal.
Source 30% of the revenue
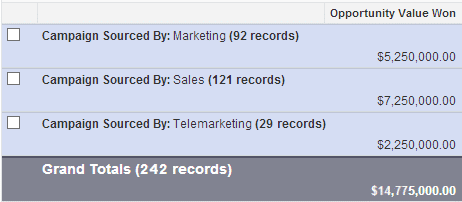
Another sample goal focuses on how much revenue marketing is sourcing. The report below shows a listing of all the sources of leads from marketing, sales, and telesales activities. 5.2M was sourced by marketing out of 14.7M in total. Marketing is sourcing 35% of the revenue so it looks like 30% would not be too much of a stretch. Maybe you should up your goal to 40% to give your team something to work towards.
Influence 60% of Revenue with Marketing Programs
Next is influence. How much revenue is influenced by marketing? This metric focuses on not just the first touch as in sourcing but all the touches throughout the buying cycle whether the customer is researching information about your product, learning more on a Webinar, attending a special prospect luncheon. All those activities are touches and can be given credit for contributing to the deal using the weighted campaign attribution models. Here’s a report below that shows how much revenue marketing is influencing.
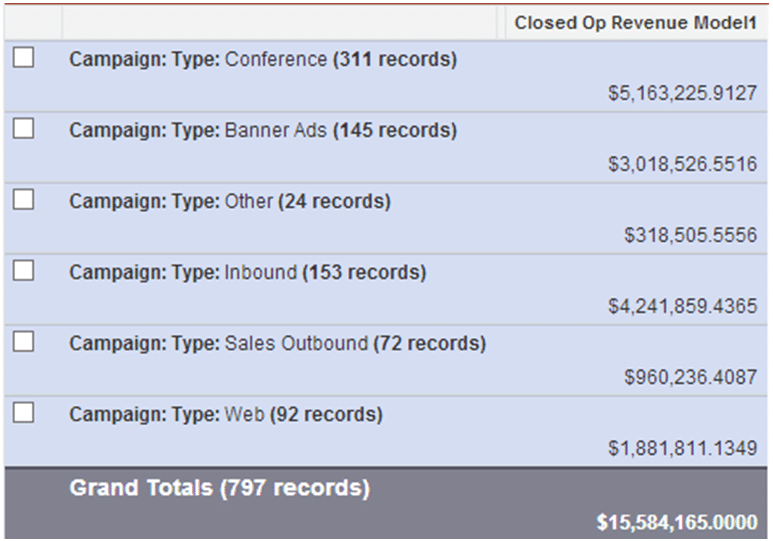
In this report, you can see the marketing is influencing 15.5M in revenue during this period. If the total revenue for the company is 30M for the period, marketing is influencing about 52% of the total revenue. So that if the goal is 60%, there’s some work to be done investigating the effectiveness of all the programs, emphasizing execution on programs that provide more influence and de-emphasizing programs that have less influence.
Improve Deal Velocity by 10%
Lastly and very importantly are velocity goals. Focusing on activities that shorten the sales cycle is a revenue driver for any company and it’s nice to know what kinds of activities are driving the best velocity.
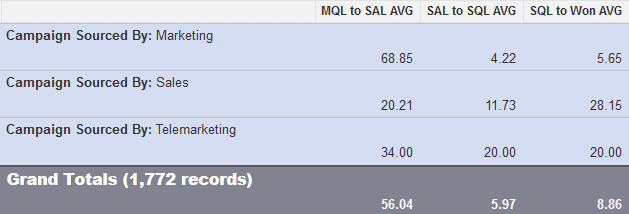
The report above shows time in stage in days. So deals sourced by marketing take 68.85 + 4.22 + 5.65 or 78.72 days to close. That’s almost 3 months. If you can shorten the sales cycle by 10% this period, that’s 71 days. If you can find a way to shorten the sales cycle by 50%, that would be a 39 day sales cycle with enormous impact on revenue and on sales costs. One method is to look for programs with shorter velocity and work to emphasize those marketing activities.
Hopefully this information is helpful as you start to think about what and how you want to measure your marketing. Once you have some baseline metrics, you can assess your performance and experiment with changes in the types of programs you are running to work towards your goals. This is an exciting time when we can actually measure the impact of marketing on a company’s revenue.
Good luck and let us know if we can help.
Transform how to track campaigns with out-of-the-box marketing attribution tools. Start making the right marketing decisions today.