This guest post comes from Laura Patterson, President of VisionEdge Marketing. A strategic marketer, data and marketing metrics master, she has helped over a hundred companies in a variety of industries fulfill their marketing potential and achieve competitive advantage.
___________________
When we ask the question, “Would you like to know how your Marketing is impacting your business?” all of the CEOs we work with answer with a resounding and unequivocal, “yes!” Why? Because having the right information readily available in a manageable and comprehensible format is essential for growth. And that is the purpose of a marketing dashboard – a visual display of the most important information needed to achieve one or more objectives; consolidated and arranged on a single screen so the information can be monitored at a glance. A well-designed dashboard provides data in a summarized graphical format and alerts users to performance values significantly above or below expectations. Once you have the right marketing metrics, data and analytics, you can develop a multi-level dashboard to manage and report on performance. These dashboards reflect the relationship between outcomes and activities and investments and consist of at least three levels: the executive level, the marketing leadership level, and the marketing functional level.
You are probably thinking, “we are reporting.” We have found that these reports range from project/activity status updates you may create in a presentation format to reports that generated by your marketing automation platform (MAP) and/or your CRM/SFA platform, such as Salesforce. These are a great start, but here’s the bad news. Regardless of the format, reporting on activities such as updates to the website, an upcoming event, the status of new collateral or a direct marketing campaign or reporting on outputs such as number of website visitors, open/clicks, followers and friends, number of marketing qualified leads – are no longer enough.
Why not? Many of the CEOs and CFOs we talk with say they find these reports inadequate when it comes to knowing what is working, what course adjustments if any are required, and whether marketing investments are being properly allocated. You can develop more valuable and insightful reports that can be used to optimize performance and make better decisions by tracking marketing metrics such as marketing contribution to pipeline, win rate and velocity of marketing-generated opportunities, marketing’s impact on new product adoption and category growth rate. Ultimately you want this data presented in a dashboard, which provides an at-a-glance view that quantifies the overall impact marketing is having on the business including how well marketing initiatives are increasing customer acquisition, retention and share of wallet.
A dashboard is a key component of performance management. In addition to fostering better strategic and resource allocation decisions, a dashboard should demonstrate how well marketing expenditures and performance targets are aligned to business outcomes. It should also enable the marketing organization to determine if it is on track for driving demand of products according to forecasts through higher quality leads to sales, improved customer retention, or increased market footprint– which is why tracking them in Salesforce (or whatever CRM system you use) makes the most sense. Your dashboard is a decision support tool that facilitates strategic decisions and course adjustments.
Use these three steps to help your team get started:
Step 1 – Create a Customer-Centric Measurable Marketing Plan.
When done properly, your marketing plan is aligned to specific quantifiable business outcomes, indicates how marketing’s contribution and impact will be measured, establishes the chain of performance targets between activities and business results, and lays the foundation for your dashboard.
For this to work, you will need to know what business needles need to be moved. The business needles, or outcomes, need to specify more than just a revenue number to chase. Identify which customers, new or existing you need to engage, how many, and what you want these customers to purchase. Armed with this information you can develop measurable marketing objectives and define the strategies, programs and tactics to support these objectives.
What might a measurable marketing objective look like? This example illustrates a measurable marketing objective designed to impact the number of customers adopting a product upgrade, “Increase customer preference among existing tier 1 and tier 2 customers from A to B percent over the next 6 months resulting in X% of these customers adopting the new platform by FYE.” Performance targets and appropriate outcome based targets need to be developed for each objective, program, strategy and tactic. This can be a daunting task if you’re just getting started. So focus on the highest priority outcomes and objectives.
Step 2 – Develop Your Metrics Schematic.
Once you have an outcome-based marketing plan and have defined the metrics that will measure marketing’s impact and value, you will need to create a metrics schematic. This schematic serves as the specification for the marketing dashboard. The metrics schematic is derived from data chains you created when you linked the marketing activities, programs, objectives and business results. These data chains demonstrate the relationships and connections between marketing activities (such as roadshow with an attendance target) marketing objectives (some number of qualified opportunities) and business results (such as new opportunities added to the pipeline quarterly.)
For many organizations, these metrics demonstrate how well marketing is affecting market share growth, customer value, and customer equity. We encourage you to select metrics from the following categories:
- Customers: acquisition, retention, value
- Product: adoption, innovation, price and/or margin
- Competitive positioning: market share, brand preference
- Financial: budget, payback/ROI, customer equity
It will be important to have quantifiable business outcomes and measurable marketing objectives to facilitate the next step.
This picture illustrates how a data chain from your marketing plan can be used to develop a portion of your metrics schematic:
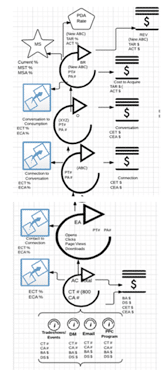
Source: VisionEdge Marketing’s Accelance(R) Application
Once you develop the metrics schematic, use it to validate your data, and workout any “bugs” before you go off and either configure your existing tools or purchase a product to produce your dashboard. The metrics schematic can also serve as your alpha dashboard to validate the data and process. This approach will help you identify what changes if any are needed to the dashboard, measurement and reporting processes. From there you can create a beta where you report actuals to performance. Once you complete this process you will know what elements and thresholds are needed.
Step 3 – Configure Your Dashboard.
Now you are ready to take your dashboard into production. This is when you will want to explore how to automate the reporting. Whether you use part of your existing marketing technology such as Salesforce, or buy a dashboard or business intelligence product, the metrics schematic serves as the guide for the metrics, data elements, and alerts.
Creating an effective dashboard requires more than just clicking the button in your existing system. So if you decide to go down this path, remember a dashboard is only worthwhile if you tie it to a structured action process and if the underlying data is accurate. It must do more than just measure your marketing; it needs to foster strategic decisions and enable course adjustments. It takes both time and investment to create a viable marketing dashboard, but it is worth to effort. A well-constructed marketing dashboard captures the most critical diagnostic and predictive metrics and visually, at-a-glance, represents patterns of performance. It enables you to diagnose the health and value of your marketing and facilitates strategic decisions and course adjustments. We encourage you to develop a dashboard that demonstrates Marketing’s alignment to the business, how Marketing contributes to the business, and that you are attaining your performance targets in terms of results, time, and cost.
Learn more about standardized dashboards built for actionable insights. Full Circle Insights has published in an eBook four distinct dashboards, called the Four Dashboards to Make Marketing Measurement Easy.
If you want to learn more about methodologies and steps for achieving proper alignment, and accountability, and for using data, marketing analytics and reporting to improve strategic decisions, performance, and marketing measurement check out Charting a Course for Marketing Effectiveness: Alignment & Accountability on the VisionEdge Marketing Website.
Transform how to track campaigns with out-of-the-box marketing attribution tools. Start making the right marketing decisions today.