 If you’re in charge of creating leads for target sectors, an industry-specific marketing and sales funnel can help you make better decisions. Say you’re tracking overall leads through the funnel, so you know the big picture. But what if one sector is lagging while another is incredibly productive? That’s information that can help you zero in on problems and opportunities — if you have it.
With a solution that helps you drive revenue with comprehensive marketing data inside Salesforce, you’ll be able to monitor overall funnel metrics to understand volume, conversion rates and deal velocity. For example, take a look at this image:
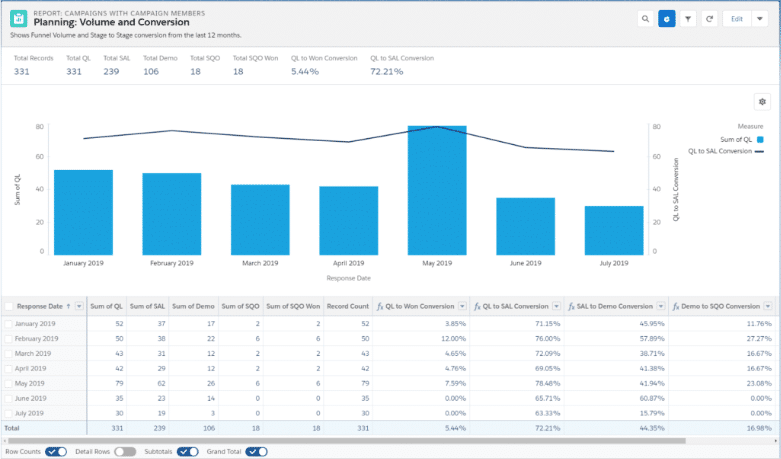
It doesn’t look like a funnel when it’s in chart form, but that’s what it shows: the progression of qualified leads (QLs) through the funnel over a period of seven months. If you zero in on January 2019, you’ll see how leads progressed through the funnel during that month:
52 qualified leads (QL) were created by marketing at the top of the marketing and sales funnel
37 QLs passed through the 1st funnel stage and became sales accepted leads (SAL)
17 SALs saw a product demo at the next funnel stage
2 became sales qualified opportunities (SQO)
2 became won SQOs
Now it looks more like a funnel. In the chart, the columns to the right indicate conversion percentages between funnel stages. That’s important because it tells you how the marketing and sales operations are doing and can suggest areas where you can improve processes or invest for better performance. You can also reverse-engineer the funnel to estimate the leads you need to hit a specific target.
Basically, without a funnel, you’re flying blind. An understanding of the basic funnel metrics — volume, conversion rates and velocity — is essential:
- Volume tells you whether you’re generating enough leads in marketing to fuel the revenue train further down the funnel. For example, in the featured image, marketing had an outstanding May, which tripled the revenue figure over January’s results.
- Conversion lets you know how marketing is performing at every funnel stage. In January 2019, 71.15% of QLs converted to SALs and 3.85% converted to won SQOs. But February 2019 was fantastic, relatively speaking, since 12% of QLs converted to won SQOs.
- Velocity is the pace at which leads convert to won business; velocity isn’t specifically included in the above chart, but you can infer it from the basic funnel metrics, which reveal the overall sales cycle length. You can use funnel metrics to identify and clear bottlenecks.
These basic funnel metrics are incredibly important, but they might not tell the whole story if you’re marketing to specific groups, such as industries. Since Industry is a standard field on most CRMs and Martech, you can break out the data into industry-specific segments, and if your martech solution tracks leads through the funnel inside Salesforce like Full Circle products do, you can get the accurate, granular metrics you need.
Say you break out the data by industry and find that conversion rate for customers in the financial services sector is fabulous, but the conversation rate for manufacturing prospects is near zero. Spotting this kind of data anomaly gives you an opportunity to investigate the performance differences and figure out what’s gone right — or what’s gone wrong.
Why does financial services outperform manufacturing? Are the sales reps more motivated on one of the sales teams? Does one team follow up on leads more quickly? Is there a big difference in the percentage of QLs that convert to SALs, which may indicate the need to adjust your campaign strategy? Is there a breakdown in the process, such as the marketing-to-sales handoff?
These are all important questions, and it’s a great idea for marketing operations and sales operations colleagues to meet on a weekly basis to discuss funnel metrics. Data anomalies might point to a sleeper campaign that is slower to convert in the first funnel stage but results in more won business. Funnel metrics are extremely useful for budgeting.
So, if you’re looking for a way to break funnel data out by industry type — or other type, such as customer size — make sure you’re using a single source of data truth that is credible with your sales team colleagues. Building an industry-specific marketing and sales funnel is a simple way to surface issues and opportunities while improving marketing and sales team collaboration at the same time.
[Ebook] Spice Up Your Marketing Funnel with Enhanced Insights
This ebook provides insights from industry leaders regarding the challenges in establishing full-funnel visibility, along with the seven elements organizations can apply to create a cohesive sales and marketing funnel.
Transform how to track campaigns with out-of-the-box marketing attribution tools. Start making the right marketing decisions today.